What are developer tools?
Every major web browser includes a suite of developer tools, which can do many things including monitoring network activity, inspecting the assets a page requested for, and how long they took to load - this can come in handy for troubleshooting. Occasionally when you encounter issues and reach out to us for assistance, our Support team may require you to extract this information from your browser for further investigation. This article describes the steps using Chrome as an example but any major browser should support the same functions.
Requirements
- A desktop or laptop computer
- A web browser
How to generate a HAR file
- Open a new browser window or tab and go to the Duco page where the issue is occurring.
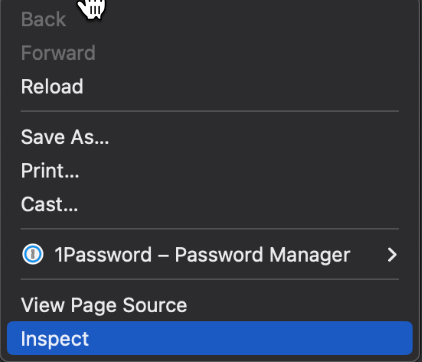
- To open developer tools for the page, right-click > Inspect.
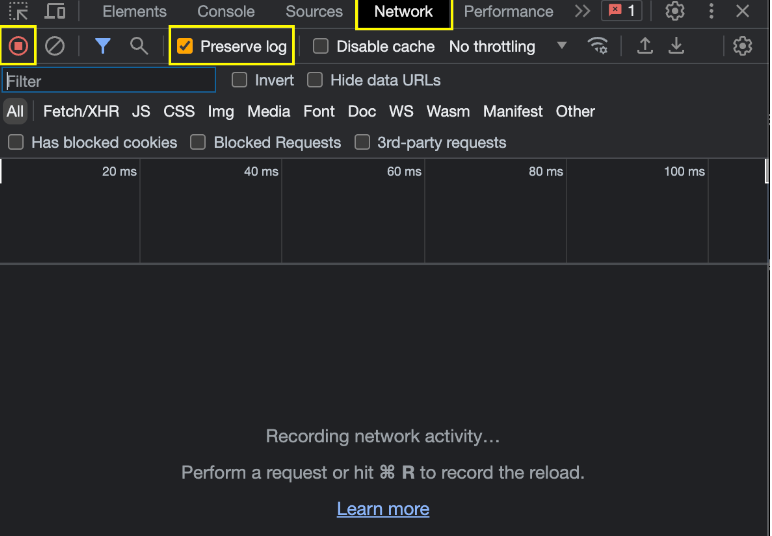
- Select the Network tab in the panel that appears.
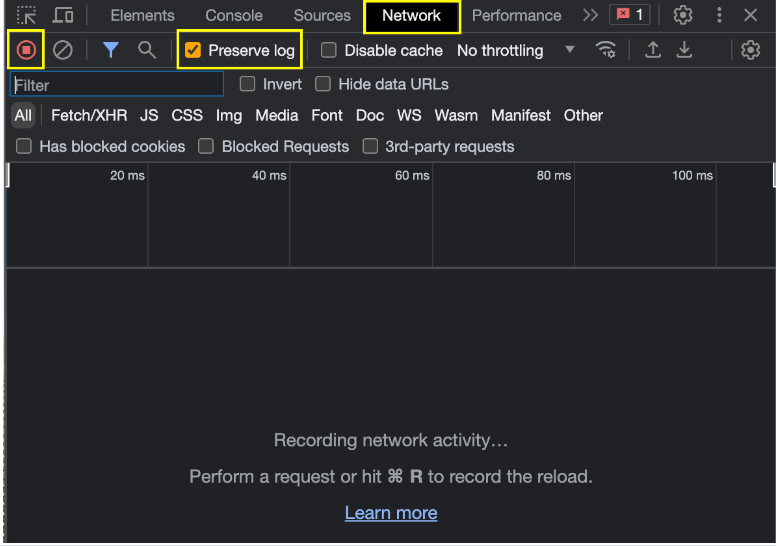
- Ensure that the red record button is active and the Preserve log option is checked.
- Perform all operations which result in the issue you're reporting.
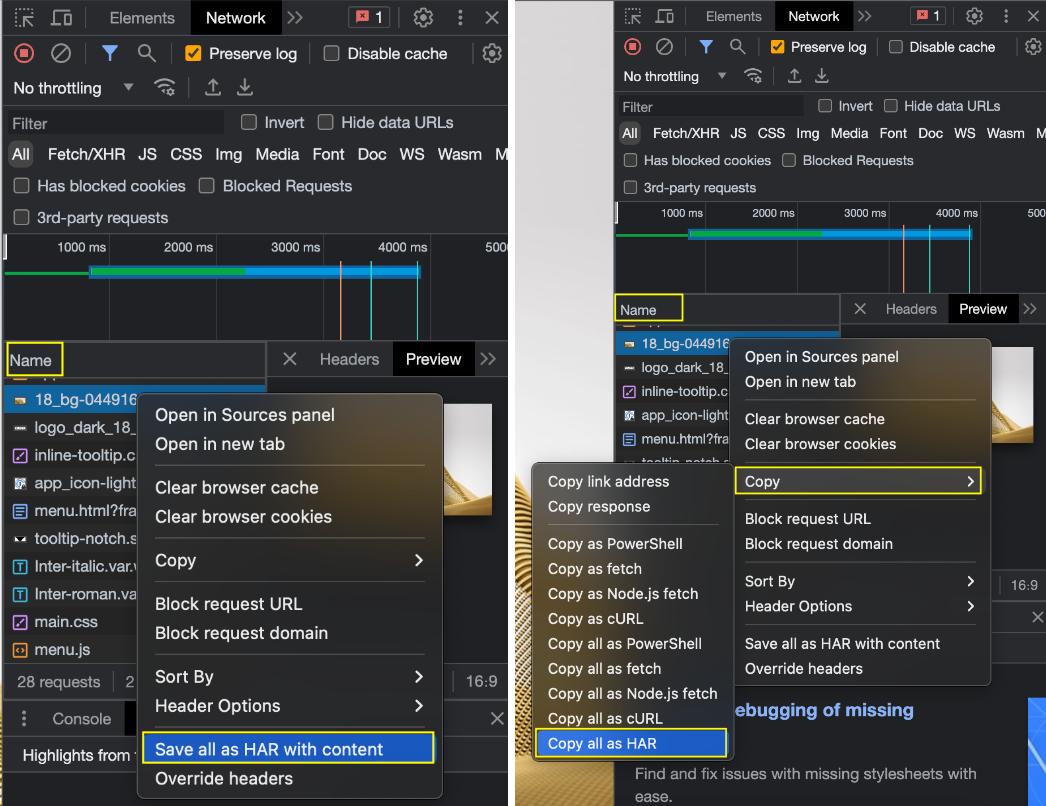
- In the developer tools, right-click any of the lines under the Name section, and select Save all as HAR with content.
In some versions of Google Chrome, you might have to select Copy > Copy all as HAR.
- If option Save All as HAR with Content was selected, simply name and save the .har file in the pop-up box.
If option Copy > Copy all as HAR was selected, paste the copied content in a text editor, then name and save it as a .har file. - Attach this file in your response to Duco.
How to take a console screenshot
- Open a new browser window or tab.
- To open developer tools for the page, right-click > Inspect.
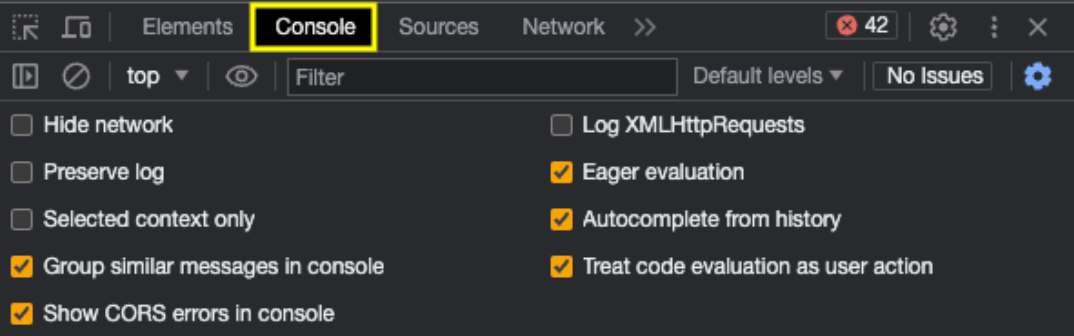
- Select the Console tab in the panel that appears.
- Login to your Duco environment with your credentials.
- Perform all operations which result in the issue you're reporting.
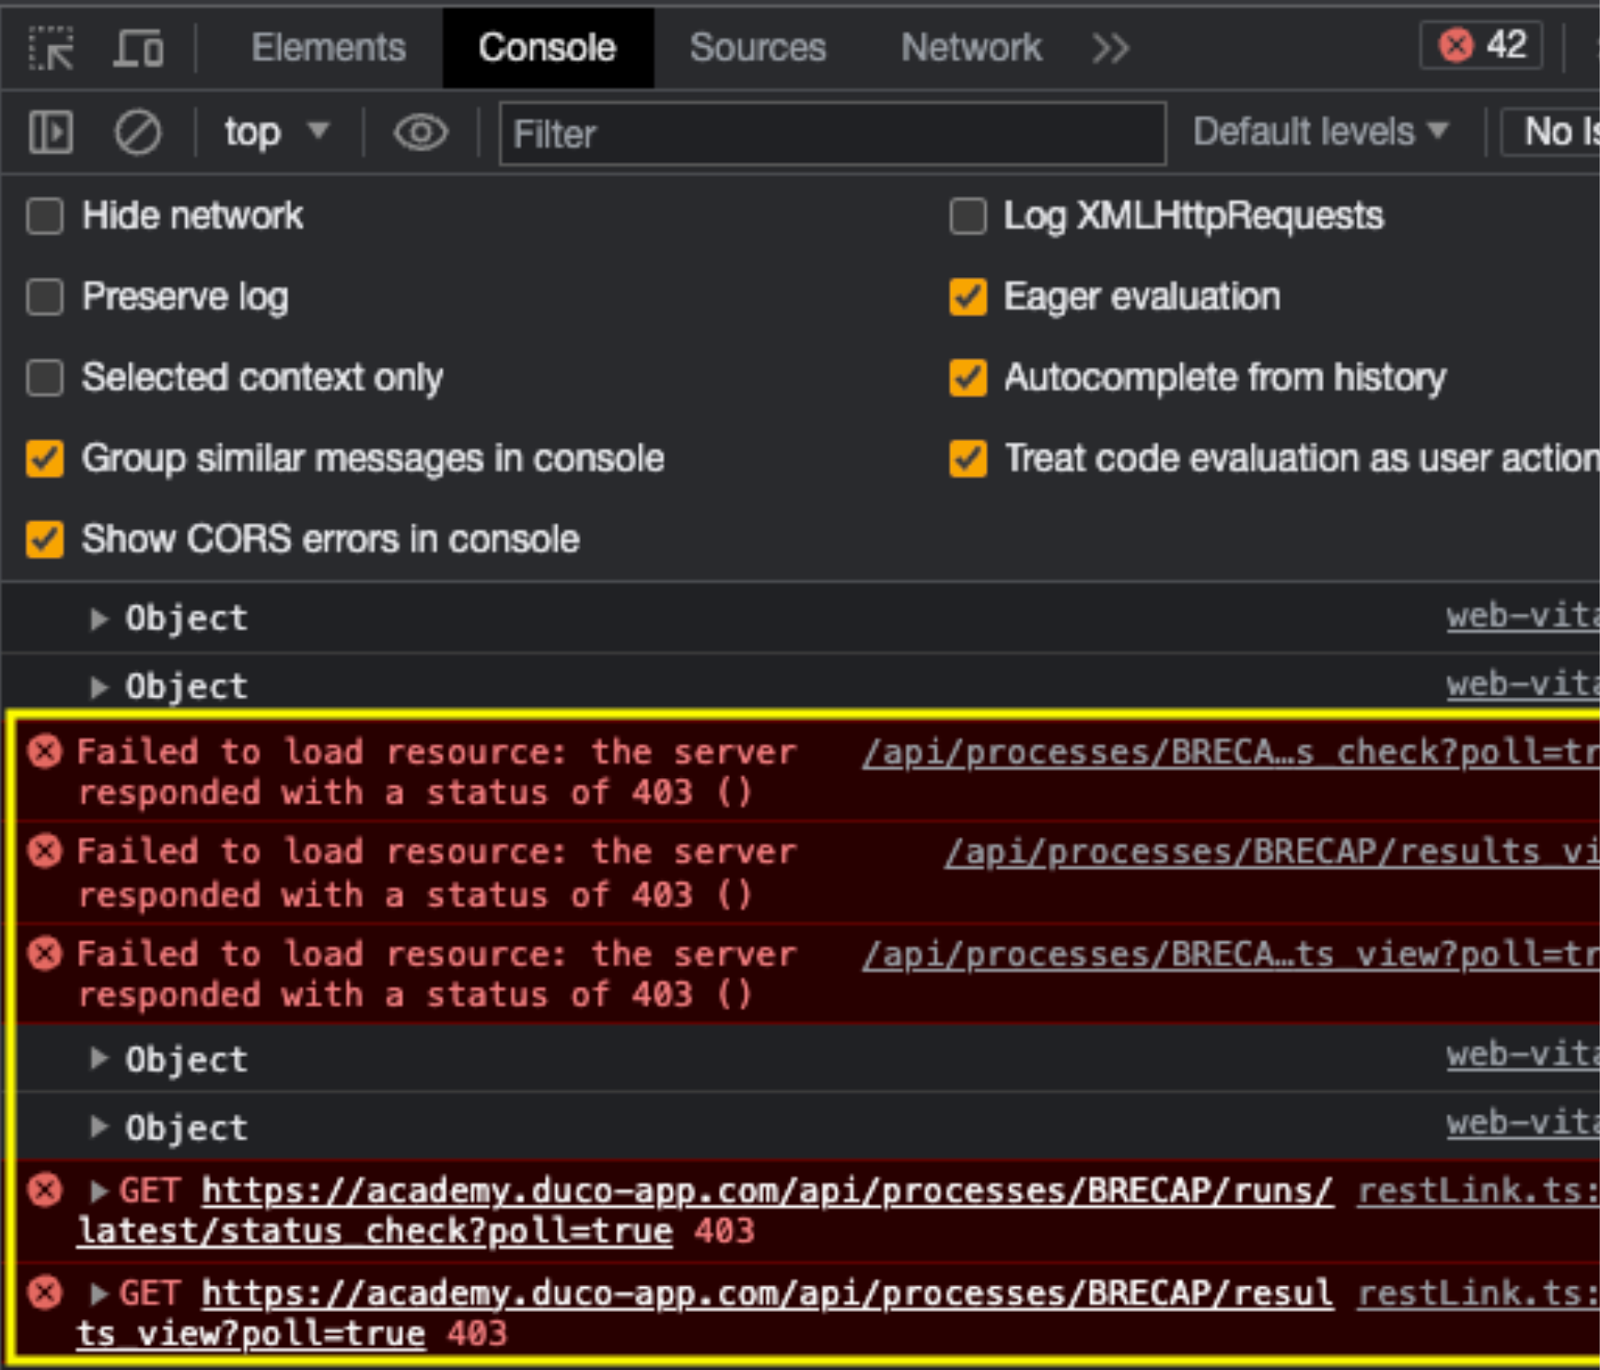
- You should see some error lines appear in red on the same tab
- Take a screenshot in which the error lines are clearly visible and attach this in your response to Duco.